01_Data visualization
02_Research
02_Research
CDMX,MX
2023 — 2024
2023 — 2024
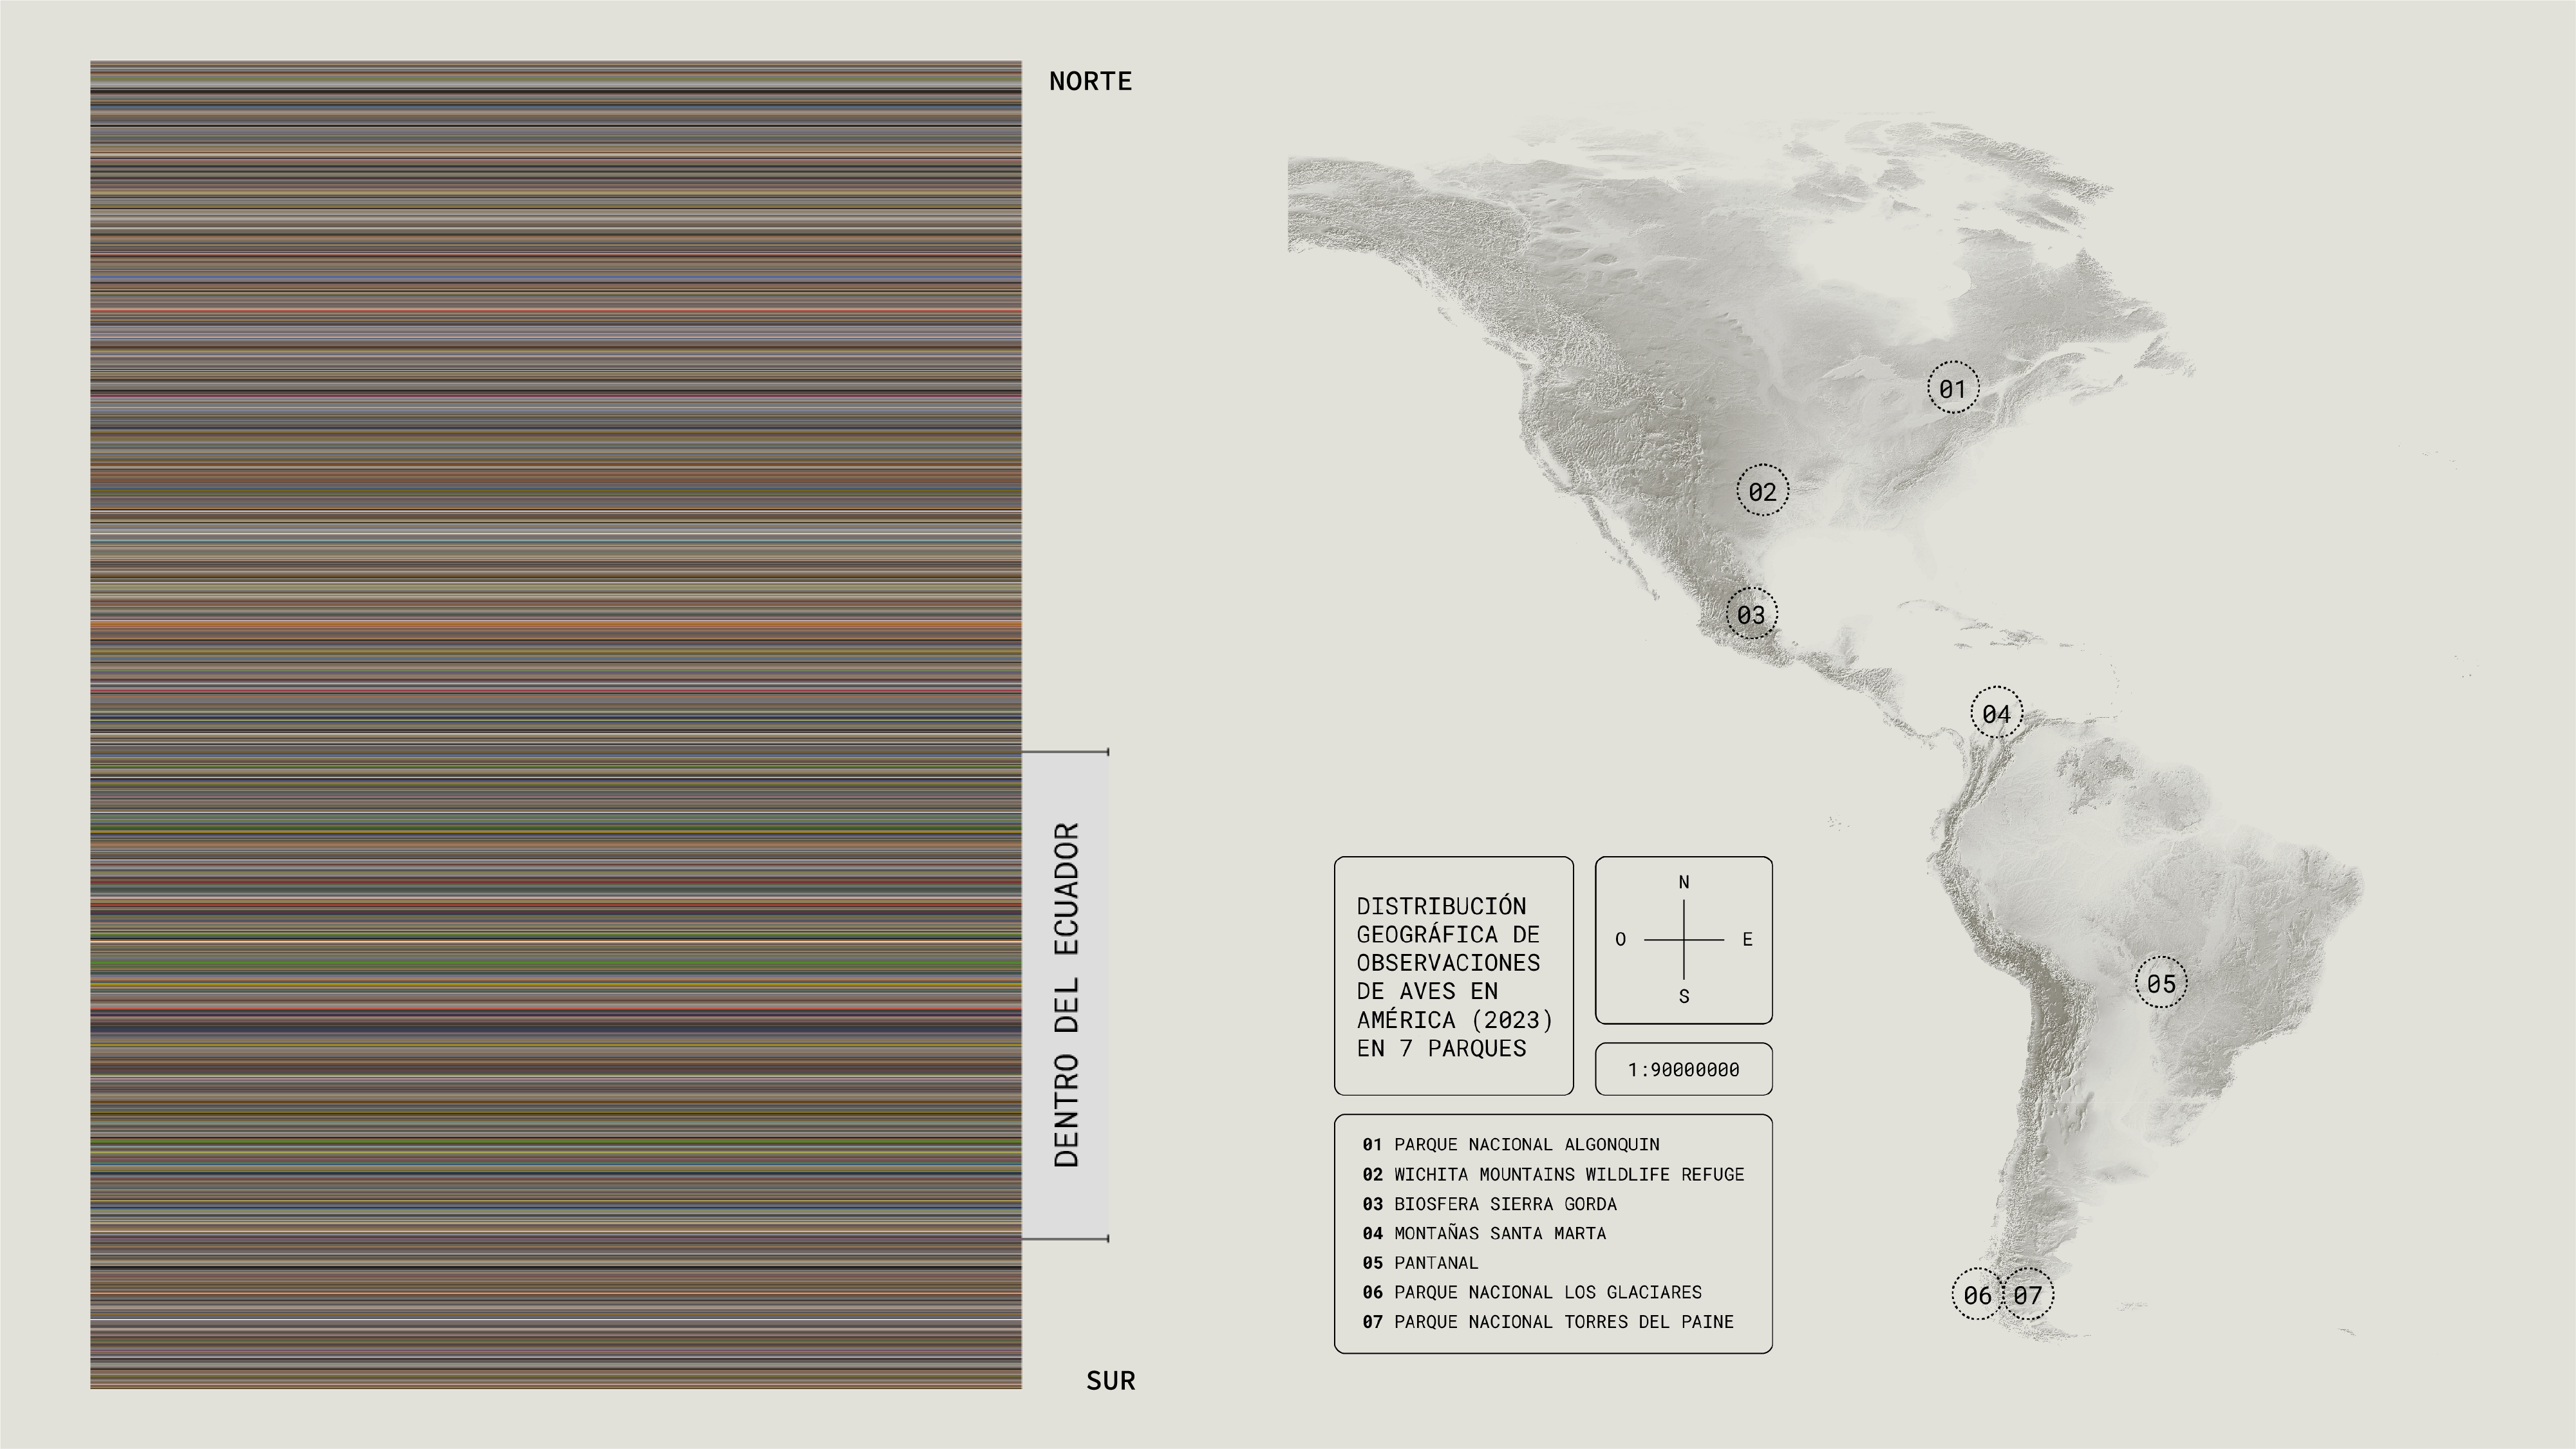
Chromatic Atlas is a project that examines the relationship between color and geography, focusing on how bird coloration changes with proximity to the equator. The study highlights how birds in equatorial regions tend to display more varied and saturated colors, influenced by environmental factors such as climate, vegetation, and ecological interactions. The visualization presents these patterns in a clear and structured way, providing insight into how geography shapes the diversity of color in bird species.
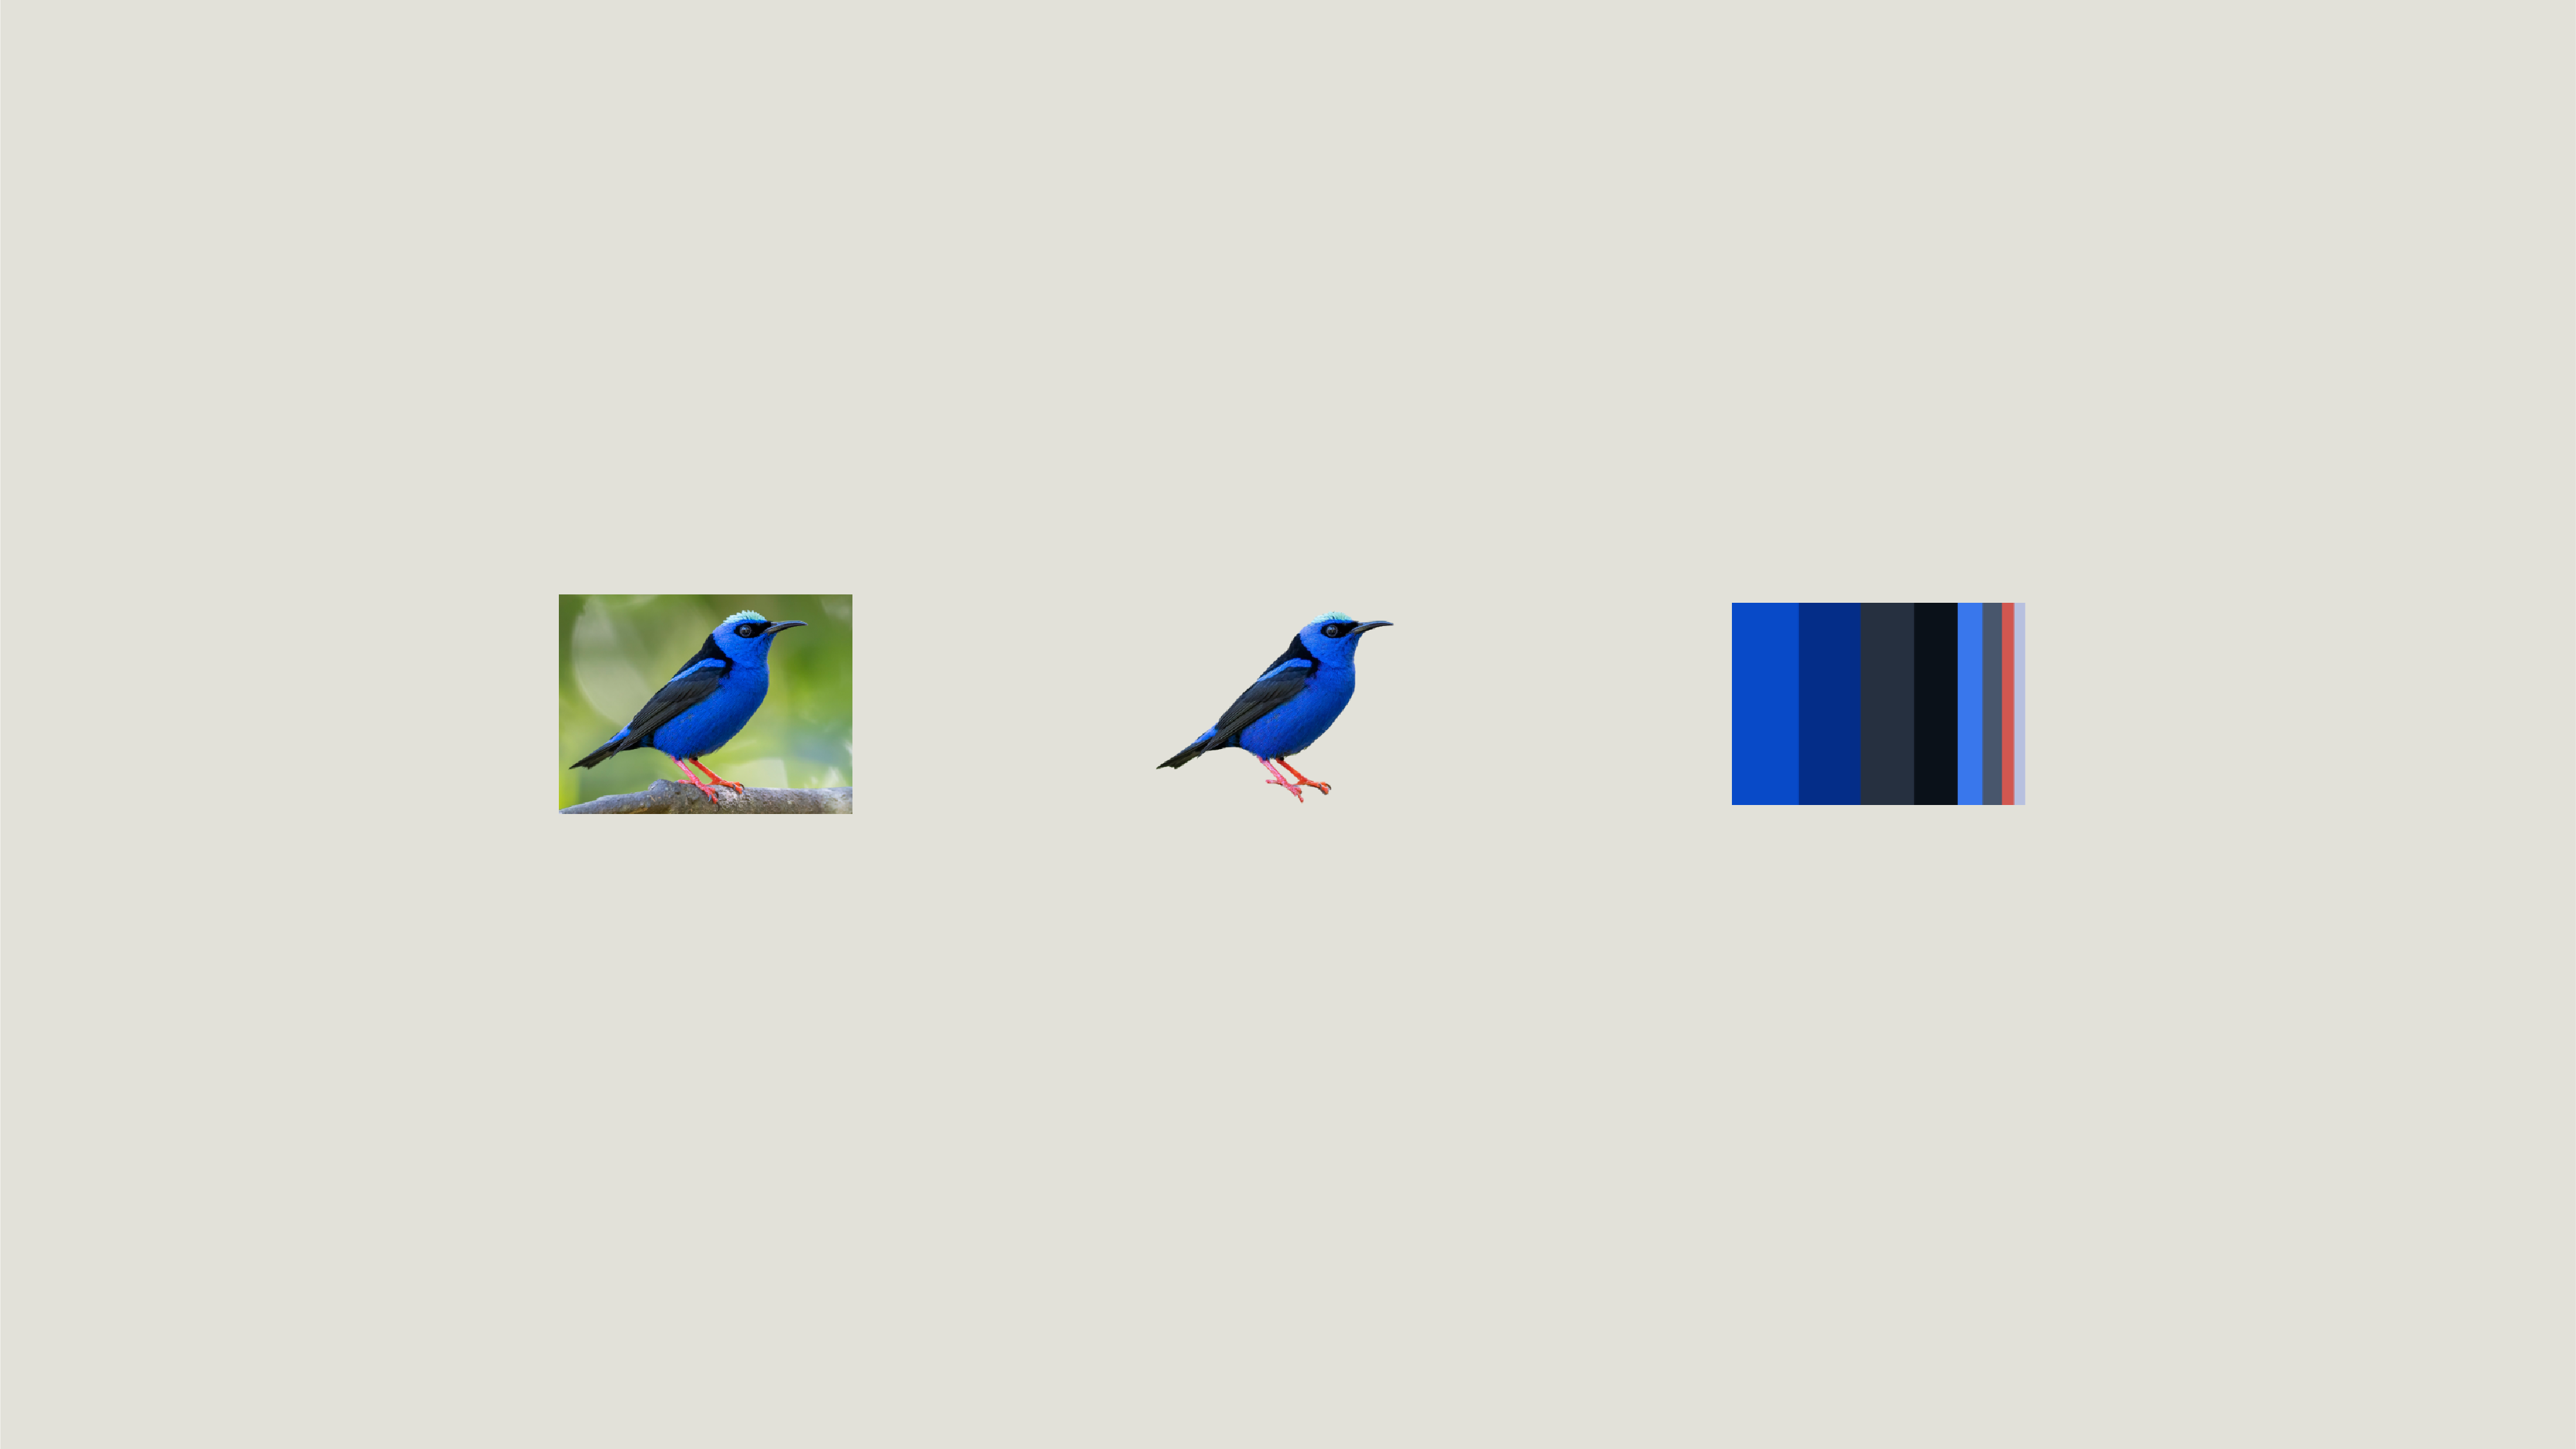
Color Analysis:
Images of the 955 species were downloaded, and using the Remove Background API, the backgrounds of the images were removed to focus solely on the birds colors. Then, in Python, the K-Means algorithm was used to develop color palettes from the images, identifying the predominant colors in each image and generating a representative palette of those colors. Subsequently, the Squarify library was used to facilitate the creation of Treemaps, providing a quick and automated way to represent the color distribution for each bird.

Canada
![]()
Mexico
![]()
Brasil
![]()
Argentina
![]()

Mexico

Brasil

Argentina

United States
![]()
Colombia
![]()
Chile
![]()

Colombia

Chile

